Case Study: Statistical Methods Applied to a Non-Manufacturing Process
QUALITY IMPROVEMENT IN RECRUITING AND EMPLOYMENT
Introduction
Even though statistical process control techniques have been in use for some time, there remains confusion regarding how those “manufacturing” concepts apply to administrative and service processes. The purpose of this paper is to describe the application of statistical methods to a non-manufacturing process, Exempt Salaried Recruiting and Employment. Though many diagnostic tools were applied by the project team, we will concentrate on the intermediate statistical methods – so often viewed as manufacturing techniques – that the team found to be both appropriate and useful in its non-manufacturing project.
The Project Team
Project team members included the Vice President, Human Resources, and all managers and professionals in the Corporate HR Department. The seven team members represented all of the Personnel functions: Employment, Organization Development, Training & Development, Compensation & Benefits, and Employee & Labor Relations.
Though he served as a member of the team, the VP was not named the project team “leader.” Instead, the team agreed to accept a suggestion by Dr. Joseph M. Juran that the “project charter be the boss.” In the first team meeting, however, the Manager, Employee & Labor Relations agreed to serve as the team leader. The Manager, Training & Development, played the dual role of project team member and facilitator.
Project Definition
During their first meeting, the project team worked to select and define an appropriate project. The team members applied Juran’s four criteria for "good" projects: focus on chronic, systems issues; significant; feasible; and measurable.
-
“Good” projects focus on chronic, systems issues. Twenty-seven ideas were generated in response to the question, “What are the chronic, Personnel-related problems facing this company and the Corporate Human Resources Department?” Suggestions covered all of the HR functions, from employment and compensation to labor relations and training.
-
“Good” projects are significant. The initial brainstorming results were reviewed based on the question, “At this time, what is the most significant need for our department’s service to managers and other internal customers?” After some discussion, consensus was reached on the following need statement:
The timely filling of today’s staffing needs and finding the leaders of tomorrow.
-
“Good” projects are feasible. The team agreed that “feasibility” was a function of the scope of the project. They also agreed that the above need statement was too broad and fuzzy. No meaningful progress could be made on such a general statement.
Therefore, each team member was asked to draft a “purpose of project” statement, keeping in mind the need to limit its scope (and thereby address the feasibility criterion). Several of the proposals were combined to result in the following “purpose of project” statement:
To reduce the time taken to fill exempt salaried job openings with clearly qualified and, in sufficient numbers, promotable people.
-
"Good" projects are measurable. Here the group first encountered the dilemma faced by many administrative and service organizations. What can be measured? Unlike manufacturing products and processes, you cannot use a micrometer, scale or other analytical instrument on a service.
However, the team members agreed that measurement was key to understanding the current situation and for monitoring future progress. The team returned to the brainstorming technique to list suggestions and answers to the questions, "What can we measure? What should we measure?"
The result of the brainstorming was a list of several data collection activities to be undertaken early in the project. On the list were plans to quantify the number of jobs open and filled during a given calendar period. The time taken to fill the jobs, quarter-to-quarter trends, and recruiting costs were also listed as items to quantify.
Results Expected
The “purpose of project” statement and planned data collection activities were summarized in a written Project Definition. Early in their second meeting, the team added to that definition a short list of expected results. These included:
- Identify the major elements of the employment process that the company can control or change to reduce the time taken to fill exempt salaried job openings.
- Draft a plan of action to control or change those elements and reduce the time taken to fill future openings.
The balance of this paper will present a few of the tools applied to achieve the project team’s expected results. Special emphasis will be placed on the use of statistical process control (SPC) techniques that are most often viewed as “manufacturing” approaches to quality improvement.
Initial Data Collection and Study
In the second meeting, the team brainstormed the question, “What are the major causes of delays in filling exempt salaried Management, Marketing, Sales, Engineering and Administrative job openings?” Responses were transferred from the flip chart to a cause- and-effect (or fishbone) diagram.
The fishbone diagram served its typically useful purpose. It reflected all of the group’s theories of what delayed the filling of the openings. The challenge now was to test those theories; to attempt to separate “opinion” from “fact.” Diagnosis of the issue proceeded with the collection and study of employment process data.
In its third meeting, the team reviewed historical attribute data on the number of jobs open and filled over a period of seventeen calendar quarters. The data were summarized using all of the basic statistical tools covered in the company’s standard training program. Below are just three examples of the data plotted on run charts.
- Exhibit 1 shows the number of exempt salaried new hires by calendar quarter between January 1, 1980 and April 2, 1984. Throughout this period, essentially the same process existed – the same number of professional recruiters; the same procedure for submitting and approving job requisitions; the same job listing and advertising practices; etc.
Despite the fact that the “same” process existed, the output (number of jobs filled) varied a great deal from quarter to quarter. At this early stage of the project, however, the team resisted the temptation to draw any hard and fast conclusions.
- Exhibit 2 plots the number of approved, open jobs by quarter during the same period. The dramatic changes in “demand” (number of open jobs) from quarter to quarter seemed to support the theory that “openings aren’t well planned.” Once again, the team agreed not to draw any hard conclusions before seeing more data.


- Given the wide fluctuation in demand shown on Exhibit 2 above, the question arose, “Are we getting ahead or falling behind?” In an attempt to answer this question, the team prepared Exhibit 3, which plots the number of jobs filled as a percentage of open jobs. When the project team reviewed the data, they noticed that they seemed to be neither “getting ahead” nor “falling behind.” The pattern appeared to be random.

- One team member, however, noted the results for the fourth quarters of 1980 and 1981, when the company filled 30% and 3% of the open jobs, respectively. He wondered, "What did we do ‘right’ in 1980 and what did we do ‘wrong’ in 1981?" This question was deferred for later in the project, when control charts would be used to analyze the variation and stability of the process.
Employment Process Variation
The third through sixth weeks of the project team’s work were devoted to the study of variation in the employment process. It began with the collection of raw variables data in the form of the time taken (in months) to fill 130 exempt salaried job openings between January 1, 1980 and April 2, 1984.
The raw data were summarized on a histogram (see Exhibit 4), which depicts the time taken from the date the open requisitions were approved to when the new employees started work during the period. The team noted that, despite considerable variation among the 130 measures, the majority of the jobs (76%) were filled in six months or less.
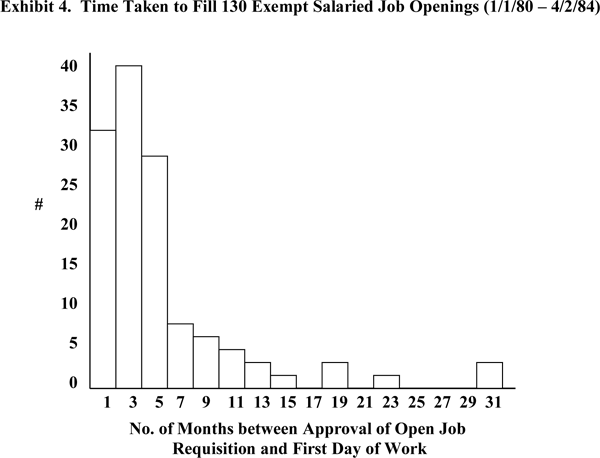
The team proceeded to measure the variation numerically. They found that the mean time taken to fill the 130 jobs (X-bar) was 5.05 months. The range (R) from the longest time taken to fill a job to the shortest time was 30.2 months.
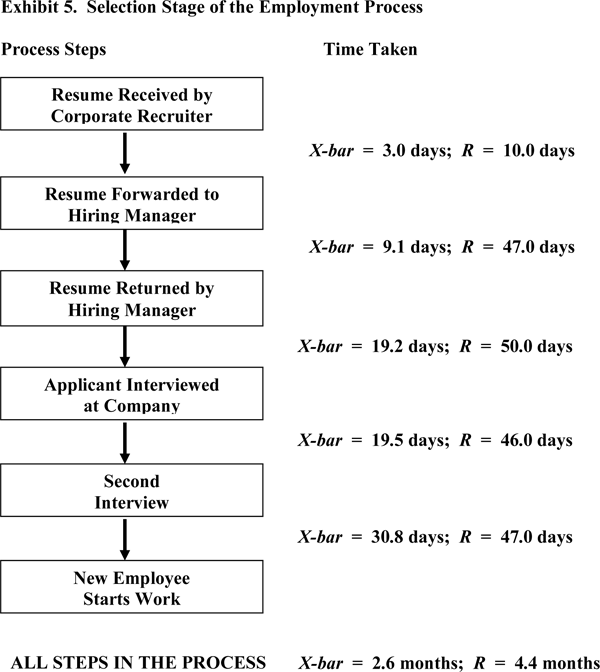
A second approach to measuring variation was applied to the employment process itself. Exhibit 5 illustrates the flow chart of the selection stage of the process. This stage flows from the receipt and review of applicants’ resumes to the newly-hired employee’s first day of work.
The team then reviewed employment logs and other prior in-house data to determine how long it took 40 recently hired applicants to move through the process. It added to the flow chart (Exhibit 5) measures of the average (X-bar) and range (R) of time taken for those successful applicants to move from one selection stage process step to the next. The time taken for the 40 new hires to move through all of the steps was then calculated. The average was found to be 2.6 months. The range was 4.4 months. These measures led to the following reactions:
-
It was a surprise to learn that, on the average, more than half of the time taken to fill the openings was spent on moving successful applicants through the company’s internal selection process.
-
This finding disproved the long-held belief that most of the time taken to fill jobs was devoted to “recruiting” activities. In the past, it was believed that once Hiring Managers saw the resume of the “right” person, they and the process moved very quickly.
-
This insight led the team to conclude that it was dealing with two species of time: the time taken to find the “right” applicant, and the time taken to move that person through the balance of the process. The team realized that any improvement plan would have to address both species of time.
-
Finally, the team noted that some applicants took considerably longer to move through the selection process than others (R = 4.4 months!). As in any manufacturing process, the data indicated a clear need to reduce the variation in the employment process.
Employment Process Stability
The team proceeded from the initial data collection to apply the concept of process stability. More specifically, they considered how statistical process control charts could be applied to the employment process and the data they had collected to date. There was a need to better understand the variation exhibited by their run charts and histogram. Was their process in statistical control?
The team agreed that, for their project and setting, control charts would be most useful if applied as analytic tools – as opposed to tools for ongoing control or holding any gains. If control limits could be placed on the data, the team would be able to determine those elements of the process that were in control (subject to common causes of random variation from within the process) and those that were out of control (under the influence of special causes of non-random variation from outside the process). Striking this distinction would be critical to selecting appropriate strategies for the team’s improvement plan.
Recall that one team member raised a question when viewing the run chart of the percentage of open jobs filled (see Exhibit 3). He wondered "what we did right" in the fourth quarter of 1980, and "what we did wrong" a year later. Before trying to explain that difference between the 30% and 3% fill rates, the team had to first determine if those quarters' results were significantly different.
So, the team converted its run chart of the percentage of open jobs filled to a p Chart. The p Chart is often used to monitor production outputs in terms of the percent or proportion defective. Standard formulas were used and resulted in the central line (CL) and control limits (UCL, LCL) shown in Exhibit 6 below.
Upon review of the p Chart, the team noted that no points plotted outside the control limits. Even the "high" and "low" fourth quarter results in 1980 and 1981 were not significantly different. They (and all the other data) plotted within the limits of controlled, random, common cause variation.

Therefore, the team concluded that they did nothing unusually "right" or "wrong" in the fourth quarters of 1980 and 1981. Those results were different, but not significantly different. Both were generated by the same process. Variation in the percent effectiveness of the employment process was subject to common causes of variation only. Reducing that variation and increasing the percentage of open jobs filled in the future would require action across the board to improve the overall process – as opposed to localized, “special” action in response to discrete outcomes.
To continue the analysis of process stability, the team organized the 130 jobs filled into twenty-six subgroups of five jobs each (n = 5). Subgroup averages and ranges were calculated and plotted on standard X-bar and R Charts. Exhibit 7 shows the resulting charts and control limits.
As in the case of the p Chart above, the X-bar Chart plotted in statistical control. The twenty-six subgroup averages, though different, were not significantly different. No evidence emerged that special causes of variation were affecting the average time taken to fill the jobs. Three points on the R Chart, however, plotted significantly high.

The team recognized that root cause analysis was the appropriate corrective action in the face of the evidence of special cause variation on the R Chart. When they studied the three subgroups with the significantly high ranges, the jobs that were open the longest (thereby inflating the Range value) all resided in the same department. It was later determined that the department manager would submit job requisitions for approval – even when he had no job openings!
The manager wanted to have the approved requisition available if or when he decided to hire someone or add staff; but nobody else knew he was doing this. The openings were being actively advertised and listed with employment agencies. HR recruiters were seeking, reviewing, and forwarding resumes – but there were no real job openings. Once the special cause was verified, that manager’s open requisitions were cancelled. He would be required to submit requisitions in the future in accordance with the standard procedure. To prevent such shenanigans in the future, the team developed and implemented the following plan.
Action Plan for Preventing “Excessive” Variation in the Future
Early in the company’s employment process, recruiters and hiring managers meet to prepare a Recruiting Plan. It lists the employment agencies, publications, tactics and timing to be used in order to fill the job openings.
The Recruiting Plan became the focus of an action plan for preventing the kind of excessive variation exhibited on the R Chart. The plan for preventing such significant and excessive variation in the future included the following action steps and timing:
| Action Steps | Timing |
| 1. Review original Recruiting Plan | 3 months |
| 2. Conduct “phone campaign” to employment agencies | 4 months |
| 3. Revise Recruiting Plan and job specifications | 6 and 12 months |
| 4. Conduct additional advertising campaigns | 6 and 12 months |
| 5. Consider off-site interviews | 6 months |
* Timing refers to how long the job has been open (from date of approved requisition).
Note that most of the above “special” steps will occur only if jobs remain open for six months or more. Since 76% of past job openings were filled in six months or less (see histogram in Exhibit 4), the above plan indeed addresses those “vital few” cases in which exempt salaried jobs remain open for a very long time.
Action Plan for Systemic Improvement
In its eighth and last meeting, the project team considered appropriate action and changes to improve the overall recruiting and employment process. Recall that the process was in statistical control as measured by the average time taken to fill the jobs (X-bar Chart) and the percentage of open jobs filled (p Chart).
With this in mind, the team employed brainstorming to generate specific action steps to change the process and thereby reduce the time taken to fill future openings. Among the items listed, and scheduled to be acted upon by the Corporate Manager of Recruiting & Employment, were the following:
- Develop and conduct an intensive training program for hiring managers. Include employment process elements, such as establishing realistic applicant specifications, as well as interview and evaluation techniques.
- Expand and intensify college recruiting in order to lend more consistency and predictability to filling selected exempt salaried job openings.
- Work more closely with hiring managers to anticipate and plan for upcoming staffing needs and openings. Include the recommendation that managers submit requisitions for planned openings one to two calendar quarters in advance of when the person is really needed. (Recall that, on the average, the current process takes 5.05 months to fill openings.)
- Establish more “networks” of outside sources from which applicants can be referred (professional societies, college professors, competitors, etc.).
- Conduct more field recruiting.
- Continue to collect data in order to maintain the control charts, track employment process performance, and monitor the effects of changes.
Earlier in the project, the team had discovered two relatively equal species of time: the time taken to generate the resume of the right person and the time taken to move that person through the balance of the process. Upon reviewing all elements of its plan for systemic improvement, the team agreed that it struck a good balance between both species of time.
More emphasis on college recruiting, networking and other sources addressed the need to reduce the time taken to generate applicants. The time taken for selection was adequately addressed by closer working relationships with hiring mangers, training and continual monitoring of the process performance.
Thirteen months after the completion of the project, the R Chart continued to show a pattern of statistical control; but the X-bar Chart showed a significant shift below the original central line. This indicated that the changes the team had made to the process had the desired effect – successfully and significantly reducing the time taken to fill exempt salaried job openings.
Project Results
After just eight weeks of work on the project, the team had accomplished the following:
- A clearer understanding of the time demands, bottlenecks and apparent effectiveness of the Corporate Recruiting & Employment process
- Recognition of specific trends, problems, bottlenecks and sources of delays that were inherent in the process
- Specific and useful data on time taken to fill jobs and other measures of variation
- The identification of “out of control” elements of the process, indicating the presence of some special cause of non-random variation from outside the process
- A successful root cause analysis to identify the special cause and action plan for preventing future (statistically) excessive variation
- Clearly defined and documented levels of performance for the “in control” elements of the process
- A sound plan of action for changes to be made to the process to improve overall process performance and reduce the time taken to fill future job openings
- Plans to continue data collection, and add other useful data, as a basis for monitoring process performance. 13 months later, it was this data collection system that showed evidence of significant process improvement.
Conclusion
The above results may be viewed as specific benefits the Corporate Human Resources Department gained from eight weeks of project work. However, one can see in that experience several general features that characterize any and all process improvement projects and teams.
-
The opportunity to transfer basic and intermediate statistical methods from previous training to a real project and, beyond that, to apply those tools to address the needs and concerns of the department’s customers (in this case, hiring managers)
-
The application to an administrative of process control concepts and techniques most often (and too often) reserved for manufacturing processes.
-
A cross-functional project team of managers and professionals from all components of the department
Most of these elements will be found in any cross-functional process improvement project. However, like most firms, this organization’s initial applications of the statistical methods were focused only on manufacturing operations. In fact, this was the first non- manufacturing project undertaken in the company.
In conclusion, the team’s project confirmed that the disciplined, analytical and quantitative statistical methods do apply when trying to improve non-manufacturing processes. The project team, as a group and as individuals, continued to apply statistical methods in all subunits of the department. As expected, the methods worked. As hoped, continuous improvement was realized in many of their processes.
References
1. Deming, W.E., Out of the Crisis, MIT Center for Advanced Educational Studies, Cambridge, MA (1982).
2. Ishikawa, K., Guide to Quality Control, Asian Productivity Organizations, Tokyo, Japan (1976).
3. Juran, J.M., Juran on Quality Improvement, Juran Enterprises, Inc., New York, NY (1981).
4. Juran, J.M. and Gryna, F.M, Juran’s Quality Control Handbook, Fourth Edition, McGraw-Hill Book Co., New York, NY (1988).
About the Author
James F. Leonard is a consultant who specializes in teaching the principles of Dr. W. Edwards Deming as a new system of management. In addition to his personal consulting work, research and writing, for 29 years he was a member of the faculty in the Worcester Polytechnic Institute’s Division of Corporate and Professional Education. Jim served as an Adjunct Professor of Psychology at Nichols College, on the Executive Development faculty at the Pennsylvania State University, and lectured at Hong Kong University. His papers and articles have appeared in journals as diverse as The Industrial Physicist magazine, Quality Progress, the Training & Development Journal, South Carolina Business, and the Juran Report. Jim also wrote the text, The New Philosophy for K-12 Education: A Deming Framework for Transforming America’s Schools. He lives in Woodstock, CT, with his wife Kate. They are grateful for and proud of their six children and ten grandchildren.
© 2012. James F. Leonard. All rights reserved.