Case Study: Beware Statistical Software!
[Due to the sensitive and potentially embarrassing nature of some of the information in this case, the identity of the client is not revealed.]
For years I have provided consulting and training services for a highly-respected components and materials manufacturer based in the United States. I’ve taught my seminars in their various locations around the world on topics ranging from basic Six Sigma and process improvement techniques to intermediate statistics, statistical process control (SPC), root cause analysis, failure mode and effects analysis (FMEA) and design of experiments (DOE). The client’s managers, engineers and teams continue to apply the techniques to accomplish ongoing and impressive improvements in the quality of their processes, products and services.
Not long ago, I visited one of the client’s overseas materials divisions to teach my seminar on Essential Statistical Methods: Statistical Process Control (SPC) Concepts and Techniques. I emphasized (as I always do) the distinction between statistical stability and statistical capability. Statistical stability has to do with the source of the variation. If a statistical process control chart shows a random pattern, we gain knowledge that the source of the variation is common causes of variation from within the process. If we are not pleased with any of the outcomes, our corrective strategy is and must be to change the process via cross-functional process improvement projects, process FMEA, DOE or other multivariate techniques. Figure 1 shows the slide that I use when introducing the concept of statistical stability.
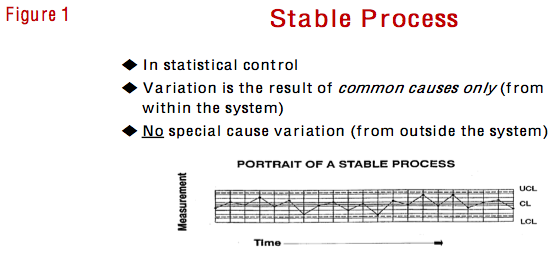
On the other hand, if a control chart shows a non-random pattern, it is indicating that the source of the variation is some special cause(s) of variation from outside the process. No amount of work on the process will address a special cause because, as noted by Wheeler and Chambers, special causes “are not part of the overall system, and should be considered abnormalities.”1 In the face of special cause variation, the appropriate corrective strategy is to take out a rifle, aim at the specific event, and endeavor to find, remove and prevent the reoccurrence of the special cause. If we do not find, remove and prevent the reoccurrence of a special cause, it can come screaming in without warning from outside the process at some point in the future – unpredictable by its very nature – and mess up any efforts to improve the process.
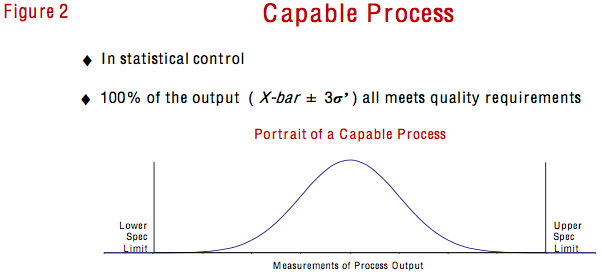
Statistical capability, on the other hand, is different. It does not have to do with the source of the variation; it has to do with the amount of variation inherent in the process. The capability of a process is defined as the extent of the random, inherent, common cause variation we observe. Thus, a capable process is one that is in statistical control and 100% of its output (as defined by the average plus and minus three standard deviation measures) all meets quality requirements. In my seminars, this is the time when I introduce the process capability index (Cpk) as a way to put a number on the picture of a process’s capability illustrated in Figure 2.
Before calculating the Cpk, however, I always stress that the process must first be in a state of statistical control. Recall that the literal definition of process capability is the random, inherent, common cause variation we observe. If a process is not stable, it is not under the influence of common cause variation; it’s under the influence of special cause variation. Therefore, a process out of statistical control has no capability to measure or compare to specification limits.
I always warn my students to beware of vendors who report that their process isn’t stable, "but it’s capable, because it's meeting your specification." I urge my clients to reject any such claims. If a supplier wants to use a "C" word to describe their process that's out of statistical control, don't let them use the "C" word "capable," because it happens to be meeting your specification today. Instead, make them use the "C" word "chaos" - under the influence of God knows what, that will strike again only God knows when!
I’m wary of statistical software; so much so that I refuse to use it when teaching my courses. Some software packages will bring up a control chart on the computer screen, perhaps showing a pattern of chaos. Because it’s programmed to do so, the software will then bring up a little rectangular box that contains Cp and/or Cpk values.
I always urge my clients to be guided by some knowledge of theory of variation. “Ignore that Cpk value – until you attack the evidence of special cause on the control chart and get the process stable!” Then and only then can we talk about “capable” and consider the Cpk.
As noted earlier, I was presenting my seminar in a materials division of a multi-national company. The division had reported great success in the application of Six Sigma techniques to one of their major products and processes. The Quality Director was a certified Lean Six Sigma Black Belt (LSSBB), and he had recently led a project that reported a Cpk of greater than 2.0 – better than Six Sigma capability. I was there to teach statistical methods to some other employees in the division who had not yet been involved in any Six Sigma projects or process improvement training.
After I warned the group about the need for stability before calculating the process capability index, the LSSBB Quality Director interrupted to declare, “If you have a high enough Cpk, it doesn’t matter if the process is stable or not. You still won’t produce any defectives.” I tried to explain that we calculate the Cpk based on the assumption of statistical control; but the LSSBB kept interrupting and repeating, “It doesn’t matter! It doesn’t matter!”
After that day’s class, I wandered back to one of the plant’s test labs where technicians were engaged in testing the pH of one of their products. They reported that they took two readings per batch and had completed tests on 33 batches of material. One of the test technicians was attending my seminar, and she gave me a copy of the sixty-six pH readings. For each batch I calculated the average and range, treating the readings as subgroups of size n = 2. (See Table 1.)
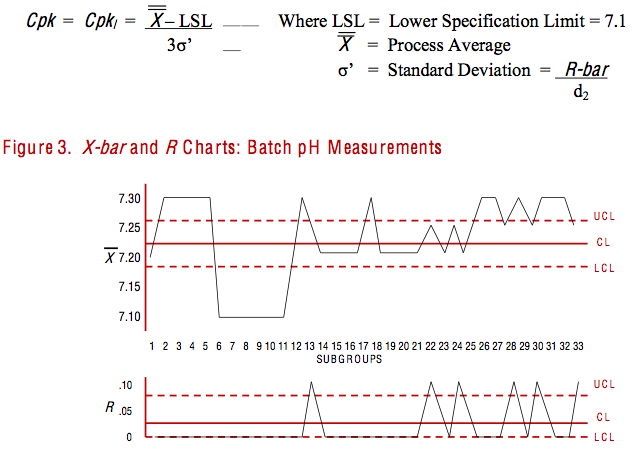
At my hotel that evening, I calculated control limits and constructed X-bar and R charts for the 33 subgroups. The resulting charts, illustrated in Figure 3, both indicated that the process was out of statistical control, under the influence of special cause variation. Some of the special cause(s) may well have been due to measurement (subgroups not large enough; lack of precision with readings taken only to one decimal point; etc.). Nonetheless, the charts showed that the process was not stable; not under the influence of common causes of variation only from within the process. Therefore, one would conclude that the process had no capability.
What will statistical software do?
I could have entered the pH readings into a computer loaded with statistical or SPC software. Then, if I sent the X-bar and R chart command, and the software would have done all of my work for me. It would have calculated the control limits and constructed the charts shown in Figure 3.
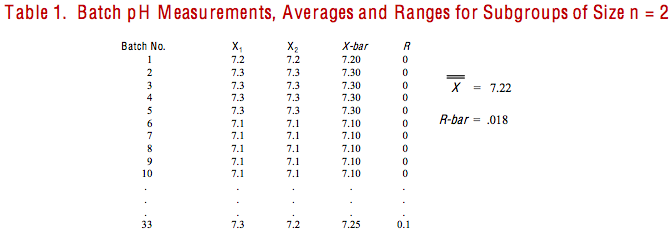
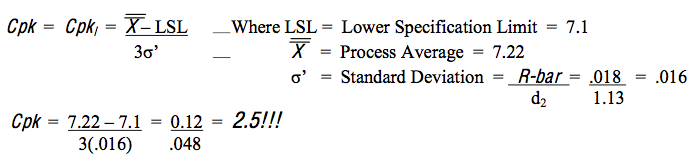
As noted earlier, however, some versions of statistical software will proceed to calculate the process capability index (Cpk), even if the process is not in a state of statistical control. In this case, the pH specification was 7.3 +/- 0.2, so for the Cpk versus the lower spec the software would use the following formula:
For the process average, some software will just pluck the central line (CL) off of the X-bar chart, completely ignoring that the chart was in a state of chaos. (I’ve been told that other software packages will remove out-of-control points from the charts and re-calculate limits for the process as if it was stable; then proceed with the calculation of the Cpk.) For the average range, or R-bar, the software simply plucks the CL off of the R chart – once again, completely ignoring that the chart clearly indicated that the process was out of control. Deep in the bowels of its algorithm, the software plugs and chugs those values into the formula, as follows:
This highly-impressive Cpk was not unlike the one reported in the wake of the Quality Director’s recent Six Sigma project. That outcome was being publicized throughout the company and other divisions were being pressured to show similar results. (“The ABC division has a high Cpk. Why don’t you?”) In fact, one of the corporate quality specialists who accompanied me on the trip said that they were publicizing the high Cpk value to some of their customers, too.
How can that be?
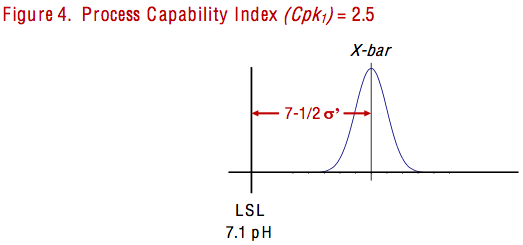
As illustrated in Figure 4 above, a process with a Cpkl of 2.5 would have 7-1/2 standard deviation measures between the process average and the lower specification limit, and 4-1/2 standard deviation measures between the lower process limit and the lower spec limit.
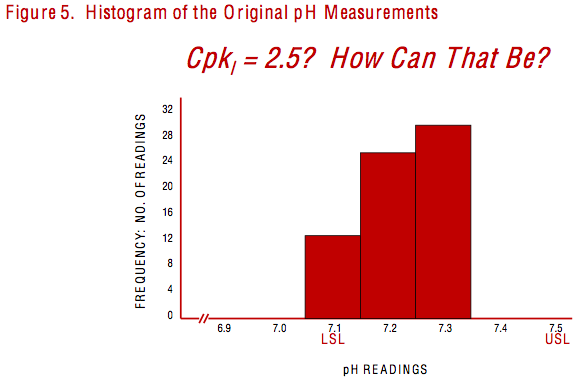
Even though some software would report the Cpk of 2.5, bear in mind that it was calculated for a process that was not stable. I returned to the original pH measurements that the test technician had given to me. Twelve out of the 66 readings were equal to 7.1 – the lower spec limit that was supposed to be 7-1/2 standard deviations below the process average! I transferred my calculations and graphs to Power Point slides, then added a slide of the histogram illustrated in Figure 5. I labeled the slide, “Cpkl = 2.5? How can that be?”
The next morning, I opened the second day of my two-day Essential Statistical Methods seminar with a summary and discussion of the first day's material. I reviewed the important distinction between the concepts of statistical stability and statistical capability and repeated my recommendation to calculate the Cpk for stable processes only. Then I showed my slides of the batch pH study. After working through the summary and showing the slide in Figure 5 above, I turned to the LSSBB Quality Director and said, "I suppose it does matter!" For the first time since the start of the course, he had nothing to say.
Later, the specialist from the corporate quality group told me that he almost fell out of his chair when I presented the pH study. He was especially concerned because the company had reported the division’s high Cpk value to some major customers. On the flight home, we discussed some options for damage control. The specialist said it was going to be very embarrassing to go back and tell the customers that the process really didn’t have a high Cpk and, in fact, was out of statistical control and therefore didn’t even have a capability!
I counseled him that it would be even more embarrassing to have a bad batch of material arrive at a customer that was expecting good product from a supplier’s self-proclaimed better-than-Six- Sigma-capability process. After our return, I met with the corporate quality group and some of the client’s marketing people. Soon after the meeting they informed the customers of the error and assured those customers that all of their divisions would continue to learn and apply statistical methods in pursuit of continuous process improvements.
Technology is no substitute for knowledge.
Dr. W. Edwards Deming once wrote, "Interpretation of data from a test or experiment is prediction – what will happen on application of the conclusions or recommendations that were drawn from a test or experiment? This prediction will depend on knowledge of the subject matter. It is only in the state of statistical control that statistical theory provides, with a high degree of belief, prediction of performance in the immediate future."2
When Six Sigma practitioners publish high Cpk values, they are in essence predicting that the process will be capable in the immediate future of producing good product. As Deming noted, however, it is only in a state of statistical control that such prediction can be believed! It is not enough to be skilled in the use of computer technology, statistical software, DMAIC, FMEA, root cause analysis, DOE, Cpk calculations and other Six Sigma techniques. We must connect our skills with knowledge of subject matter – and knowledge of theory of variation.
For this reason, I never open my Essential Statistical Methods seminars by showing examples of control charts. Dr. Deming taught me that examples without theory teach nothing, just as “experience is of no help in management unless studied with the aid of theory.”3 So, before introducing the various control charts, I tend to place a lot of emphasis on systems thinking and theory of variation, including the distinction between statistical stability and statistical capability. Deming also taught me that there is no substitute for knowledge. Among my clients and students, I want to see less dependence on technology and statistical software and more dependence on knowledge to guide decisions, predictions and plans for improvement.
I’m grateful to the clients and students who have responded positively to my approach. Three kind testimonials follow and serve as the conclusion to this case study on the dangers of using statistical software without the guidance of knowledge.
"This is the first Statistical Process Control training that helped me understand the basics behind the method." - Iya Pokidov, Principal Mechanical Engineer, MKS Instruments
“Professor Leonard has passion about exploring data and then using analytical techniques to find out how best to improve a process. Specifically, he was able to show me how to cut through the fog to get to the very practical uses of SPC.” - Walter Towner, President, Satellite Viewpoint LLC
“Jim has run a number of highly effective training sessions and consultancy exercises for us, based on the continuous improvement principles of Dr. W. Edwards Deming. He is a highly motivating and energetic trainer who has the skill to assist people to translate the theories into concrete action that delivers real results. Very highly recommended.” — Geoff Tompsett, Corporate HR and IT Manager, Biocompatibles plc.
Notes
- D. Wheeler and D. Chambers, Understanding Statistical Process Control, Statistical Process Controls, Inc., Knoxville, TN (1986), p. 10.
- W. E. Deming, The New Economics for Industry, Government, Education, Second Edition, MIT Press, Cambridge, MA (2000), p. 103.
- W.E. Deming, “A System of Profound Knowledge,” from J.F. Leonard, The New Philosophy for K-12 Education: A Deming Framework for Transforming America’s Schools, ASQ Quality Press, Milwaukee, WI (1996), p. 316.
© 2012. James F. Leonard. All rights reserved.