Theory of Variation
At the output of any process – be it administrative, development, teaching and learning, or manufacturing – we will find variation. As Dr. W. Edwards Deming declared in one of his executive seminars in Chicago in 1989, "Variation there will always be – between people, between products, between machines, between vendors. The key question is, What is that variation trying to tell us about the process, and about the people who work therein?"
As it relates to optimizing a system’s performance, Deming wrote, “Fortunately, precise optimization is not necessary. One need only come close to optimization. As a matter of fact, a precise optimum would be difficult to define. The Taguchi Loss Function will apply. The loss function at the bottom – minimum loss – will be a parabola. One may move a short distance along the curve in either direction from the optimum, but rise in the vertical only an imperceptible distance.”1
The farther one moves from the target or optimum, however, the greater the loss. Thus, since increased variation generates greater loss, we can define quality as minimal variation around the target or optimum value; and we can define quality improvement as reduced variation over time around the target or optimum value.
Variation is the Enemy!
Just as the Taguchi Loss Function illustrates that it’s not necessary to achieve some precise optimum, it also illustrates that any variation brings with it some waste, cost, and loss. Variation in one component will always lead to difficulties in assembly with a mating component. Thus, the “bottom line” of Taguchi’s model is that variation is the enemy – because it always generates loss.
- In a manufacturing operation, the part is already good or bad by the time we inspect it. Inspection adds no value. The enemy is the variation and sources of variation in and around the design and manufacturing processes.
- In school, students already know or do not know the material by the time they sit down to take a test. The enemy is the variation and sources of variation in learning and achievement swirling in and around the teaching and learning process, of which the students are but a part – and students can learn no better than the process allows.
- In accounting, costs are already within or over budget by the time the audit’s conducted. The enemy is the variation and sources of variation in and around the cost and budgeting system.
- In administrative or development projects, the project is already on schedule or not by the time the project milestone review meeting occurs. The enemy is the variation and sources of variation and delays in and around the project management process.
- In transportation, deliveries are already on time or late by the time they arrive at the customer’s receiving dock. The enemy is the variation and sources of variation and delays in and around the scheduling, production, test, packaging, and distribution processes.
The key to successful quality and process improvements, then, is not to sit at the end of the process and rework defects, remediate students, or expedite late orders or over-budget projects. If variation is the enemy, the key is to determine what type of variation we’re dealing with, and then pursue appropriate corrective action to ultimately prevent defective outcomes in the future.
Bonnie Small and her colleagues reported that variation (fluctuations) can fall into either "normal" or "abnormal" patterns in a manufacturing process.
Fluctuations in the data are caused by a large number of minute variations or differences: differences in materials, equipment, the surrounding atmospheric conditions, the physical and mental reactions of people. Most of these differences are extremely small. They cause the pattern to fluctuate in what is known as a "natural" or "normal" pattern.
Occasionally, however, there will be a large or unusual difference, much more important than all the other differences put together... These large differences make the pattern fluctuate in an "unnatural" or "abnormal" pattern.2
Types of Variation3
If we agree that variation is the enemy, we must first seek to determine what type of variation we’re up against; because different types of variation require completely different types of corrective action. In the face of one type of variation, systematic root cause analysis works like a hot knife through butter. In the face of a different type of variation, apply that technique at your peril! Similarly, in the face of one type of variation, design of experiments (DOE) applies. In the face of a different type of variation, apply DOE at your peril.
If we don’t know what type of variation we’re facing, any discussion of responsibility is meaningless. American business schools and management systems today are obsessed with the issues of accountability and responsibility. Who’s responsible? Who can we hold accountable? Who’s the process owner? Absent an understanding of the type of variation we’re up against, any such discussion is a burlesque; because different types of variation require completely different types of corrective action for which different people are accountable.
Early in the 20th century, Walter A. Shewhart, a physicist at Bell Laboratories, first took a stab at operationally defining two very different types of variation one may encounter at the output of a process. As reported by Donald Wheeler and the late David Chambers, Shewhart reached the following conclusion: "While every process displays variation, some processes display controlled variation, while others display uncontrolled variation."4
1. Controlled Variation
♦ Controlled variation is random.
Shewhart wrote that control could be conceived as "a mathematical state characterized by the quantitative aspects of the end results and describable in mathematical terms and an operation of drawing at random."5 (Deming once commented on Shewhart's highly technical style of writing: "He said that his writing had to be fool-proof. I thereupon let go the comment that he'd written his thoughts so damned fool-proof that no one could understand them!"6)
♦ Controlled variation is mathematically predictable.
If someone rolls a pair of dice, we can mathematically predict that the outcome will fall somewhere between a two and a twelve, inclusive. Over a series of dice rolls, we find that there is only one combination on the dice that will give us snake eyes (1-1); but there are six combinations that will result in a seven (1-6, 2-5, 3-4, 4-3, 5-2, 6-1). So, over a series of dice rolls we can mathematically predict that we’ll roll a seven six times more often than a two or a twelve; but the individual outcome of any one dice roll will fall at random within those predictable limits, given those predictable probabilities.
♦ Therefore, controlled variation is due to random chance.
2. Uncontrolled Variation
♦ Uncontrolled variation is non-random.
♦ Uncontrolled variation is not mathematically predictable.
Back to our dice rolls: If we were to toss the dice and roll a 13 that would be goofy! There’s no way we could mathematically predict when some fly was going to come along and drop a miscellaneous dot on one of our sixes at the same time the one-in-36 random chance of rolling two sixes came into play.
♦ Therefore, uncontrolled variation is due to some assignable cause.
Deming’s Contribution to Shewhart’s Theory of Variation7
In the mid-1930s, Deming added to Shewhart’s core theory of variation when he connected the dots between the theory of variation and the concept of a process. He started to refer to “controlled” variation as common cause variation and to “uncontrolled” variation as special cause variation.
1. Common Cause Variation
♦ Controlled
♦ Random
♦ Mathematically predictable
♦ Due to common causes of variation…
♦ From within the process or system
With the deployment of the basic statistical methods, teams collect data. With intermediate statistical methods, the teams analyze those key measures. If those evaluative data plot in a random pattern, then we will know that the source of the enemy (variation) is the process itself!
Figure: Shewhart's Concept of a Process
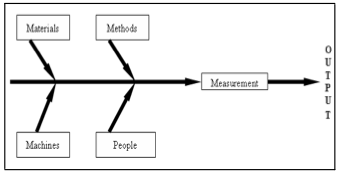
When a team discovers that it’s dealing with controlled, common cause variation, then they will know that the source of the enemy is multiple causes of variation from within the process. There will be no single, smoking gun, root cause (singular) of the problem. The appropriate corrective strategy, then, will not be to conduct root cause analysis, but to work to improve the process via cross-functional teams, design of experiments (DOE), process failure mode and effects analysis (PFMEA), or some other approach that will accommodate multiple variables. We need recommendations (plural) for changes (plural) we can make to the process because the source of the defects or problems is common causes (plural) of variation.
As it relates to the issue of accountability, management – and management alone – is responsible for common cause variation. This responsibility cannot be delegated and cannot be dodged, no matter hnow many green belts or black belts that are certified and deployed. Why? Because only management has control over all components of a process. (See Shewhart's model above.)
People who work in the process (Deming referred to them as "local workforce personnel") do not have control over capital spending. They cannot go out and buy better equipment and tooling. They're but a part of the process. Local workforce personnel do not control purchasing policy. They cannot go out and buy different or better materials or components or select different suppliers. These and other sources of random, common cause variation are management's responsibility, and management alone is responsible to see that appropriate action is taken to reduce the variation.
Now, let’s connect the concept of a process to Shewhart’s definition of “uncontrolled” variation.
2. Special Cause Variation
♦ Uncontrolled
♦ Non-random
♦ Not mathematically predictable
♦ Due to some special cause of variation
♦ From outside the process or system
If a team finds that evaluative data plot in a non-random pattern, then they gain knowledge that the source of the problem is some special cause of variation from outside the process. Cross-functional team projects, multivariate designed experiments, and other efforts to work on the process would not be appropriate. (The problem isn’t coming from the process.) Instead, the appropriate response is to apply systematic root cause analysis: name the problem; describe the problem; list possible causes; test possible causes; identify most likely cause (singular); verify true cause (singular) – because we’re up against a smoking gun root special cause (singular).
Local workforce personnel are responsible for special cause variation. They most often work closest to the process and most often will be the first to see the evidence of a special cause. When they do so, they are responsible to identify the special cause and initiate corrective action. They may not always be able to remove a special cause. If it's a tooling problem, for example, they must at least channel that information to the tooling engineer. In all cases, they must immediately inform their supervisors when the existence of a special cause is observed.
And that’s the theory! It’s not enough to be skilled in root cause analysis, 8D, FMEA, DOE, or other techniques. We must connect our skill with knowledge – knowledge of theory of variation.
Understanding Variation is Essential
Dr. Deming insisted that some knowledge of the theory of variation is a critical component in the system of profound knowledge. Failure to distinguish between common cause and special cause variation is a source of staggering waste in American industry. Deming cited two mistakes people make in attempts to improve processes, both costly.
Mistake 1. To treat as a special cause any problem, failure, accident, breakdown, shortage, etc., when actually it came from common causes. This leads to tampering, not process improvement.
Mistake 2. To attribute to common causes of variation any problem, failure, fault, accident, breakdown, shortage, etc., that in fact was the result of a special cause. This leads to wasted resources invested in the process, when the actual source of the problem was a special cause of variation from outside the process.
Thus, it is not important whether or not an individual or team takes action in the face of a problem or in efforts to improve processes. What’s critical is that we take appropriate action. Knowledge of theory of variation leads to appropriate action and avoidance of the costly mistakes. When trying to determine the appropriate corrective action, however, we encounter a dilemma.
The human brain is incapable, by eye or feel, of determining whether we’re facing common cause variation or special cause variation. The PhD statistician’s brain is incapable, by eye or feel, of looking at a data set, a run chart, or a histogram and finding the line of demarcation that informs us where the effects of common causes of random variation from within the process leave off, and where the effects of some special cause of non-random variation from outside the process becomes evident.
We need help. The statistician needs help. We need some practical statistics. This is where learning and applying the powerful, intermediate, analytic, statistical process control methodology comes into play.
Summary
At the output of any process one will find variation. The challenge facing leaders is to determine what that variation is telling them about their processes and about the people who work in those processes.
Walter Shewhart developed a theory regarding two distinct types of variation: controlled variation and uncontrolled variation. Deming added to Shewhart's work by connecting the concept of a process. Thus, when key measures of process outcomes fall in a random pattern one learns that the variation is the result of common causes of variation from within the process. In such a case, if one is not happy with any of the outcomes, the only appropriate corrective strategy is to change the process. (i.e., Develop recommendations [plural] and make changes [plural] to the process.) Management is responsible for common cause variation.
On the other hand, if the evaluative data plot in a non-random pattern, then the theory of variation teaches us that those outcomes are the result of some special cause(s) of variation from outside the process. Corrective action must be taken to identify, remove, and prevent the reoccurrence of the special cause. No amount of work on a process will correct this type of variation because it's coming from outside the process. Local workforce personnel are responsible for special cause variation. It is their responsibility to get on any evidence of a special cause like a chicken on a June bug; to identify the special cause and initiate corrective action.
Deming defined two costly mistakes that result from failure to understand and differentiate between these two very different types of variation. Mistake 2 treats special cause variation as if it were generated by the process. This leads to wasted investment of corrective action and resources into the process when the process didn't do it! Mistake 1 reacts to random, common cause variation as if it were due to some special cause. This leads to wasted effort and tampering, as opposed to process improvement.\
Shewhart's analytic theory of variation, together with Deming's refinements, yield knowledge of variation. This knowledge is the foundation for differentiating between the two very different types of variation – common cause variation from within the process and special cause variation from outside the process. Helping leaders apply knowledge of theory of variation (the second component of Deming's system of profound knowledge) is the role of the intermediate statistical methods. Readers are encouraged to continue their education and learning of those powerful techniques.
Notes
1 W. E. Deming, “A System of Profound Knowledge,” from J. F. Leonard, The New Philosophy for K-12 Education: A Deming
Framework for Transforming America’s Schools, ASQ Quality Press, Milwaukee, WI (1996), pp. 310-311.
2 B. Small et al, Statistical Quality Control Handbook, Western Electric Company, Charlotte, NC (1956), p. 6.
3 J. F. Leonard, Statistical Process Control (SPC) Tools & Concepts (Seminar Workbook), Jim Leonard Process Improvement,
Woodstock, CT (2018), pp. 3.3-3.4.
4 D. Wheeler and D. Chambers, Understanding Statistical Process Control, Statistical Process Controls, Inc., Knoxville, TN (1986),
p. 5.
5 W. A. Shewhart, Statistical Method from the Viewpoint of Quality Control (1939), Reprinted by Dover Publications, New York, NY
(1986), p. 8.
6 C. Kilian, The World of W. Edwards Deming, Mercury Press, Rockville, MD (1988), p. 57.
7 J. F. Leonard, op. cit., pp. 3.5-3.7.
© 2019 James F. Leonard. All Rights Reserved.