The Bead Experiment
Challenging people to think about systems and theory of variation
In his seminars Dr. W. Edwards Deming used to conduct an experiment using beads to demonstrate the character of systems and variation. Referred to as the bead experiment or the red bead experiment, this demonstration used the following materials:
- Two plastic containers
- Four thousand small beads (3,200 white beads and 800 red beads)
- A paddle with 50 depressions used to scoop beads out of the container (50 beads at a time)
To conduct the experiment, Deming would have six volunteers from the audience pour all of the beads from one container to the other, then insert the paddle to withdraw 50 beads. They were urged not to draw out any red beads because red beads were considered to be defective. Inspectors would count and record the number of red beads in the paddle after each drawing. The data (number of red beads) would be recorded for each volunteer over a simulated four-day period.
Andrea Gabor explained the purpose of the bead experiment as follows:
[With the] red bead experiment, Deming illustrates a "typical" production scenario to show two things: first, that the performance of individual workers can be no better than the system (as defined by management) allows; second, that the performance of any system is by nature variable, and therefore differences between the performance of two different workers are a matter of chance and thus frequently utterly meaningless.1
In my own seminars I also conduct a bead experiment. My materials and procedure differ from those used by Dr. Deming; but the lessons of the experiment remain the same. The balance of this paper will describe the procedure and lessons to be learned from the bead experiment.
The Procedure
Rather than using loose beads, two containers, and a paddle, my process has just one machine: the bead box. The box measures 19 centimeters long, 3.5 centimeters high and 10 centimeters deep. Inside the box are 1,000 white, yellow, purple, red, green, and blue beads. Out of the total of 1,000 beads, 100 of them are blue. The top and bottom of the box are covered with plexiglass to keep the beads in the box.
On one end of the bead box is a lever which, when pressed, allows beads to fall down into a plastic sheet of 100 holes at the bottom of the box. Releasing the lever traps those 100 beads in the holes. By turning the box over and pressing the lever again, the holes at the bottom are cleared.
To conduct the experiment, four volunteers are selected from among the seminar participants. Before proceeding, the volunteers are asked if they’re interested in quality. If they respond yes, they are designated “willing workers” and allowed to proceed. If a volunteer asks what is meant by quality or any other stupid question, he or she is dismissed and another volunteer is selected.
Next, the four volunteers are asked to sign a pledge showing their commitment to quality and customer satisfaction. The pledge reads:
I hereby pledge to be a QUALITY WORKER,
to produce only the HIGHEST QUALITY WORK,
and to do my utmost to achieve ZERO DEFECTS.
Signed,
____________________
____________________
____________________
Beads, Inc.
If any worker hesitates to sign the pledge, he or she is dismissed. Another volunteer is selected – one willing to commit to quality without hesitation. Additionally, since there are only three spaces for signatures, the fourth volunteer usually signs somewhere else on the form. When they do so, such volunteers are commended for their initiative.
A fifth volunteer is selected to play the role of the local manager. This volunteer need not be interested in quality nor sign the pledge. Since the fifth volunteer plays the role of manager, all that’s necessary is that he or she knows how to count.
The four willing workers are next provided training in how to operate the bead box, according to the following standard operating procedure (or SOP):
- Do not shake the box.
- Hold the box at waist level with the top facing up and the bottom facing down.
- Push in the lever on the side of the box and hold it in throughout step 4.
- Slightly tilt the box from side to side four times. (A gentle tilt is called a “doink.” The workers are cautioned not to tilt the box too far, because that would be a “schwaunk.” They are to “doink” the box, not “schwaunk” it.)
- Release the lever, in doing so trapping 100 beads in the holes at the bottom of the box.
- Pass the box to the manager.
The workers are urged not to produce any blue beads. Blue beads are defective. It’s all right to end up with white, yellow, green, purple, or red beads – but no blue beads.
The manager’s job is to count the number of blue beads in the holes, record that number, and report it to top management. (The rest of the seminar audience plays the role of top management.) Because top management support is so critical for good quality outcomes, throughout the exercise they chant, “Be a quality worker! Be a quality worker!”
The manager continues to count the number of blue beads produced by each worker and records those results each day over a simulated five-day period. The bead box is then passed to the next worker, who clears the holes in the bottom of the box and repeats the procedure. Day by day, and run after run, the manager builds the record for the week’s work. The table below shows the final results of the bead experiment in a recent seminar.
Number of defective (blue) beads
Operators Mon Tue Wed Thu Fri Totals
Jacob 9 7 16 6 7 45
Molly 19 15 19 10 15 78
Justin 13 14 16 11 15 69
Maryanna 21 11 21 16 18 87
Weekly Total 279
Supervisory Practices from the Age of Mythology
Upon viewing the workers’ results on Monday, top management was dismayed. None of the workers achieved the goal (zero defects). It was noted, however, that Jacob did considerably better work than his co-workers, producing less than half as many defectives as either Molly or Maryanna. Therefore, management started to consider the adoption of a merit pay system. After all, it wouldn’t be fair to reward Maryanna and Molly the same as Jacob. A merit pay system would empower Jacob’s supervisor to reward him for his superior work.
On Tuesday, three of the four workers improved their performance. Obviously the possibility of earning large merit increases motivated them and they had also learned from Monday’s experience. Supervisors could look forward to continuing improvement.
Wednesday’s results were a great disappointment. All four workers produced more defective beads than they had on the previous day. Even Jacob more than doubled his number of defectives in comparison to Tuesday. Supervisors held a meeting and listed of their activities to date.
- They had worked on the workers’ attitudes, making sure they were interested in quality.
- They had provided them with good training in how to operate the bead box.
- They had provided the workers with a clear and measurable goal (zero defects).
- They had provided the workers with immediate feedback each day regarding their performance.
The supervisors noted, however, that they had failed to give the workers an incentive! Therefore, at the beginning of the workers’ shift on Thursday, it was announced that whoever produced the lowest number of defectives that week would receive a free trip to Disney World for them and their family. Having provided an incentive, the supervisors were confident that the workers’ performance would improve. After all, workers will not apply themselves to their tasks without some external motivation to do so. Besides, competition among the workers for the free trip would drive everyone to do better.
The supervisors’ faith in the power of incentives was rewarded on Thursday. All four workers produced fewer defectives than the day before. Jacob set a record for the week for the fewest number of blue beads, and even Molly cut her number of blue beads almost in half.
Friday’s results produced still more disappointment as everyone’s level of performance dropped again. Jacob’s increase in defectives was very small, however, and his low number of blue beads for the week won the trip to Disney World. A closer look at the week’s totals led the supervisors to the following conclusions:
- Jacob produced only 45 defective beads.
- Maryanna produced 87 blue beads – more than 93 percent more defectives than Jacob.
- All four workers produced a total of 279 defectives, for an average of 69.75 blue beads per worker.
- Finally, it was noted that half the workers (Jacob and Justin) produced below the average number of defective beads, and half the workers (Molly and Maryanna) produced above the average number of defective beads. Half the workers were worse than average!
Rewarding Performance
Many managers find it totally unacceptable when half of their workers are below average. So, they adopt merit pay, bonus systems, grading, recognition and other practices to reward above-average performance and withhold rewards from workers who demonstrate below-average performance.
In the case of our bead business, management established a 5 percent merit budget for this period. Based on their performance, the four workers were given the following pay increases:
- Jacob performed well above average, so the supervisors voted him a 9 percent pay raise.
- Justin performed slightly better than average, so he got a 6 percent raise.
- Molly did worse than average, so she received a 4 percent pay increase.
- Maryanna, who produced over 93 percent more defective beads than Jacob, was given only a 1 percent raise. (Her supervisor would have given her no raise at all, but he didn’t want to have to explain it to HR!)
Note how merit pay and similar practices empower supervisors to reward above-average performance and withhold reward from below-average performers. If Molly and Maryanna want bigger raises, they’ll work to perform better than average. As long as they continue to perform at below average levels, they will continue to receive below-average raises.
This practice is fair and consistent with everything we ever learned and believed as good supervisors and good Americans. After all, this country was built by above-average people, dragging below-average people along on their coattails. It’s also completely consistent with most companies’ merit review systems. During my seminars, I always insist that rewarding our four workers the way we did was not only fair, but the right thing to do.
Some of my seminar participants, however, will occasionally argue that it’s not fair to differentiate the raises among the workers. They claim that the bead experiment is a lottery and that half the workers will always come out above average while the other half will always come out below average.
To counter such ridiculous claims, I suggest that the results of our experiment are no longer beads, but test scores (number of incorrect responses). Then, I review with those participants what we do in America’s classrooms. We label Jacob gifted and talented. We give Justin a B, we give Molly a C, and Maryanna gets an F – unless we grade on a serious curve, in which case she might get a D.
The traditional grading system in America’s schools does to students exactly what I did to the bead workers. Above-average students get A’s and B’s. Below-average students get D’s and F’s. We would never do to innocent, defenseless children that which was not fair. Therefore, because they’re based on the results produced by workers and students, merit pay and grades are not only fair, but also consistent with everything we ever learned and believed as good supervisors, good teachers, and good Americans.
The Missing Ingredients
What was missing from the bead business? One thing that was missing was a systems perspective. (Appreciation for a system is the first component of Dr. Deming's "system of profound knowledge.")
Throughout the bead experiment, we reacted to the workers’ daily outcomes as discrete events. On Monday, Jacob produced less than half as many defective beads as Maryanna or Molly. Based on this discrete event, management began to consider a merit pay system. Then, on Tuesday, three of the workers’ performance got better. Based on this discrete event, we concluded that the mention of merit pay had an effect. After viewing Wednesday’s (discrete) results, we announced the contest for the free trip to Disney World. When the workers’ performance improved on Thursday, we concluded that the incentive was working.
In other words, throughout the week we reacted to all daily results as discrete events, as opposed to stepping back and trying to understand all of the outcomes – high and low, good and bad – as outputs from some system. In the absence of a systems perspective, however, we have no choice but to assign all of the outcomes to the workers alone; then rank, grade, reward, and punish accordingly.
Frederick Taylor’s factory model included the idea of piecework incentive pay for production workers. Taylor lacked a systems perspective. Therefore, he had no choice but to assign machine outputs to the machine operator alone – then rank, grade, reward, and punish accordingly with piecework incentive pay.
Nobody knows who did it; nobody knows exactly when it occurred. But whoever proposed the traditional grading system and whenever that system was adopted in America’s schools, we obviously lacked a systems perspective. In the absence of a systems perspective, we have no choice but to assign test scores to the students alone – then rank, grade, track, sort, group, label, reward, and punish accordingly!
Also missing from the bead business was any knowledge of theory of variation (the second component of the system of profound knowledge). That theory would teach that half of my workers will and must be above average, and half of my workers will and must be below average. We distributed rewards (and punishments) because the workers’ performance was different; but we did not determine whether or not those performance levels were significantly different.
Absent knowledge of theory of variation, we ended up punishing half of the workers for doing the best they could do; punishing them when perhaps they could do no better. Because the performance of a system is by its very nature variable, all of the workers were constrained by the system itself.
What was missing from the bead business? The missing ingredient was profound knowledge – specifically appreciation for a system and knowledge of theory of variation. In the absence of a systems perspective and some knowledge of variation, we have no choice but to continue to apply merit pay, grades, and other destructive practices from the age of mythology.
Applying the Systems Perspective and Knowledge of Variation
To add the missing ingredients to our bead business, one need only transfer the defectives data to a statistical process control chart. Control charts help people to understand variation; to determine whether measured outcomes are different or significantly different; whether or not there's anything special about the outcomes. Deming noted, “The Shewhart control charts do a good job in a wide range of conditions. No one has yet wrought improvement.”2
The outcomes of our bead production process were measured using attributes data. Such data can fall into one of only two categories: good or bad; on time or late; above or below standard; correct or incorrect; and so on. Since every run of the bead experiment had the same area of opportunity for defectives (we produced 100 beads at a time), the type of control chart we should use to analyze our process is the np chart (for “number of defectives”).
Using the standard control chart formulae for the np chart, we would arrive at the following results:
- Central line = CL = Average number of defective beads per operator per day = 13.95 (round to 14.0)
- Upper Control Limit = UCL = 24.4
- Lower Control Limit = LCL = 3.6
The control limits indicate the upper and lower limits of controlled, random, common cause variation. Any measured outcomes that fall within those limits are different, but they’re not significantly different. They were all produced by the same process.
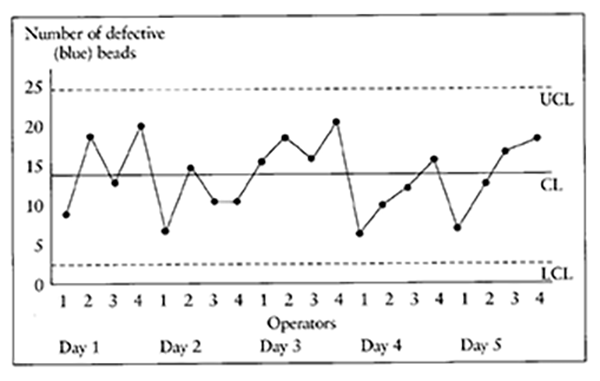
np chart for the bead experiment
Returning to the raw data from the bead experiment, we would plot the 20 measures of defective beads per person per day over time. The resulting chart (above) illustrates a random pattern, clustered around the central line, with no points falling outside the upper or lower control limits. One guided by some knowledge of the theory of variation would conclude:
- The bead production process is stable, or in statistical control.
- All of the variation is the result of common causes only from within the process.
- There is no evidence of special cause variation from outside the process.
- The measured outputs, though different, are not significantly different.
- If one is not happy with any of the outputs, he or she must change the process. If we do not change the process that’s producing the blue beads we will continue to experience the unacceptable outcomes, falling at random somewhere between 3.6 and 24.4, with an average of 14.0 defective beads.
As it relates to traditional practices of performance appraisal and grading, the fourth conclusion above is perhaps the most difficult to swallow. After all, Maryanna produced over 93 percent more defective beads than Jacob; but the theory of variation indicates that this difference is not significant! The systems perspective would add that Jacob alone did not produce the low number of defectives; nor did Maryanna alone produce the high number of blue beads.
Rather, the same system – of which Jacob, Molly, Justin, and Maryanna were but a part – produced all of the defective beads; and those workers could perform no better than the system allowed. Therefore, differences in the performance of the workers were the result of a lottery, and comparisons between them would be meaningless.3
Lessons of the Bead Experiment
1. As previously noted, the process was stable, in statistical control.
2. All of the variation – as measured by the number of blue beads produced by the workers – was the result of common causes only from within the process. Sources of the common cause variation included not only the workers, but also the materials (beads), methods, machine (bead box), measurement system (accuracy of the manager's counts), and other variables.
3. Therefore, we assigned to the workers alone outcomes that in fact were produced by the system. About this lesson of the bead experiment, Deming wrote:
All the variation – differences between willing workers in the production of [defective] beads, and the variation day to day of any willing worker – came entirely from the process itself. There was no evidence that any one worker was better than the other.4
4. The workers' outcomes, though different, were not significantly different. They occurred at random and as the result of chance. (By the way, all stable processes are random.)
5. Because the workers’ outcomes were not significantly different, we were wrong to differentiate their rewards. All should have received the same raise. Of course, if any worker had produced a significantly high or low number of blue beads, he or she may be rewarded differently if the special cause was assignable to the operator alone.
6. If the control chart plotted midterm test scores (instead of blue beads) among 20 students, the capability of the teaching and learning process is such that it would produce at random raw scores between 75.6 and 96.4, with an average of 86.0. Those test scores, though different, would not be significantly different. Since they’d be produced by the process, and not the students alone, issuing different grades to the students would be no different from the way we (arbitrarily) rewarded and punished the workers in the bead experiment!
As an adjunct professor of undergraduate psychology and graduate operations and industrial engineering, by the end of a term I always had more than enough data to determine valid limits of random variation in students’ test scores and other assessments. If the students’ final scores were different, but not significantly different, I would issue all A’s. And I’d always get a call from the dean!
I had to explain that I cannot rank students in a group that constitutes a system. Both schools required grades. If they wanted me to issue B's, I'd give all the students B's. If they wanted me to issue C's, I'd give all the students C's; but I refused to rank students in a group that constituted a system. Doing so would violate everything I teach about systems, theory of variation, and analytic statistical methods.
7. Recall that out of the total of 1,000 beads, 100 of them were blue. Therefore, one might expect that over time the process would yield an average of 10 blues beads for every 100 produced. Since 10 percent of all the beads were blue, most people would assume that, on the average, 10 percent of the beads will come out blue (10 out of 100).
Another lesson of the bead experiment is that such thinking is flawed. Even in the closed-loop system of the bead box, there are common causes of variation at work, among them:
- Different-sized holes into which the beads are trapped
- Different-sized holes, through which the beads must pass before being trapped
- Variation in size, weight, and density of the 1,000 beads
- Different size, weight, and density of the blue beads
- Effects of static electricity on the plastic beads from the plexiglass cover, shaking of the box by workers, humidity in the room, carpeting, etc.
Therefore, we have no right to expect an average of 10 blue beads! We have a right to expect – in the absence of special causes or changing the process – outcomes that fall at random between 3.6 and 24.4 blue beads, with an average of 14.0 – not 10!
8. If we’re not happy with these outcomes, management must fulfill its responsibility to change and improve the process. Workers’ performance will be no better than the system allows it to be, and management defines the system.
9. Management’s goal (zero defects) was beyond the capability of the system it had provided for the workers. Because the lower control limit of random, controlled, common cause variation fell at 3.6, neither the process nor the workers were capable of achieving the goal of zero defects.
10. The best any one worker could perform on any given day, however, would not be 3.6 defective beads – even though that was the lower control limit. Systems are by their very nature variable; there will always be variation. Therefore, the best any one of our workers could do on any given day will be somewhere between 3.6 and 24.4 defective beads. That’s the best they can do – they can do no better!
Summary
In American business, government, and education, why do we persist in punishing people like Maryanna when they do the best they can do; when they’re constrained by the system; when they can do no better? Why do we persist in issuing low raises to workers? Why do we continue to issue low grades to students when it’s the system that’s failing?
If students in the school of business do not have an opportunity to ponder the lessons of the bead experiment – early and often in their undergraduate and graduate studies – they emerge with the power to destroy people. If students in the school of education do not have an opportunity to ponder the lessons of the bead experiment in their studies, they emerge with the power to destroy children.
Sadly, today managers and teachers are wielding that power without mercy; because they wield that power without knowledge. Dr. Deming always insisted that there’s no substitute for knowledge. His bead experiment was a powerful way to demonstrate the importance of knowledge of systems and variation. It is hoped that this summary will prove helpful in your efforts to educate people in your own organizations. Good luck!
Notes
1 A. Gabor, The Man Who Discovered Quality, Times Books, New York, NY (1990), p. 59.
2 W.E. Deming, The New Economics for Industry, Government, Education, MIT Center for Advanced Educational Services, Cambridge, MA (1993), p. 180.
3 Gabor, op. cit.
4 Deming, op. cit., p. 172.
Most of this material was originally published in J.F. Leonard, The New Philosophy for K-12 Education: A Deming Framework for Transforming America’s Schools, ASQ Quality Press, Milwaukee, WI (1996), pp. 219-235.
© 2019 James F. Leonard. All rights reserved.